Adding Prometheus metrics to my discord bot
And the big question of: What is too much?

About Marodas
As some might know, I'm making a Discord bot that is supposed to become public someday™. I called it: Marodas. Marodas is built, so its features are opt in, meaning the bot only does what the server owner actually wants. All of its features are separated into different modules.

More information about Marodas
For a long time, I wanted to track certain metrics of my bot in Grafana. I have several reasons for this:
- Learn how to create (and design) Grafana dashboards.
- Learn how to "generate" metrics with python.
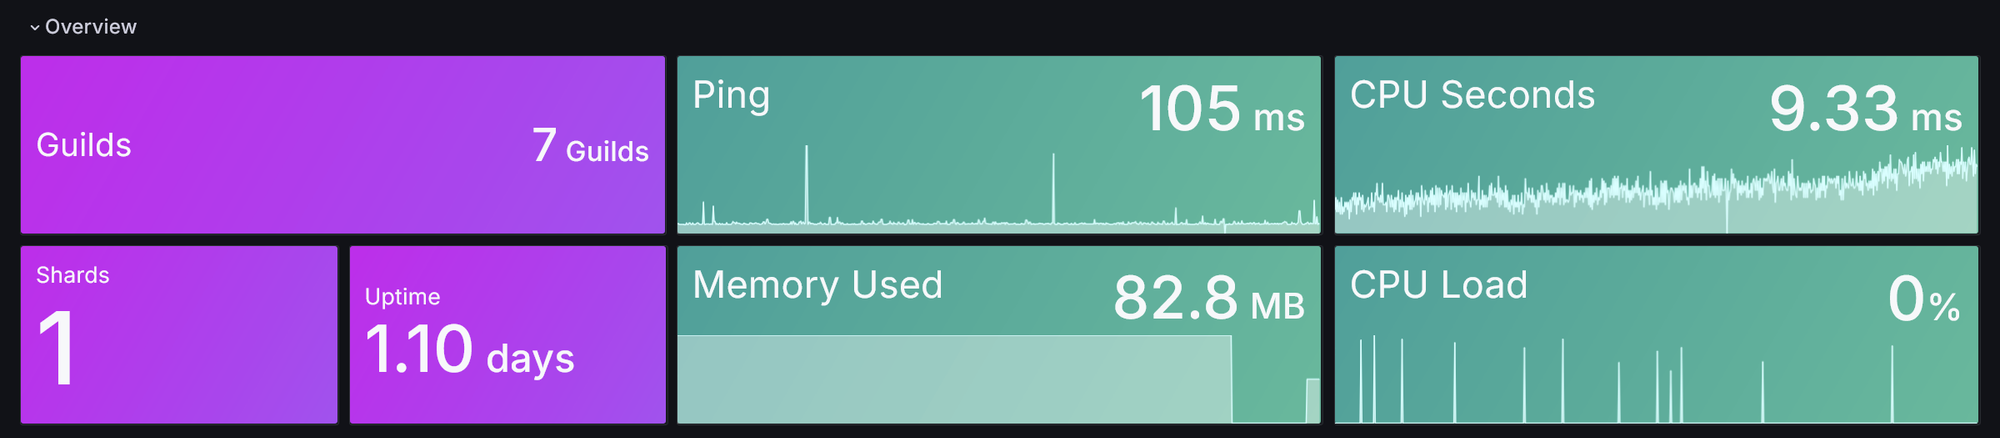
- See important metrics of my bot – for example, how many guilds my bot is on.
I tried several different metrics already, and after some playing around, I am pretty happy with what I have. That's why I wanted to share my journey here.
Setting up the web server
For Prometheus to collect any metrics at all, I need a web server on my python project that outputs the metrics in a format that Prometheus can read. Luckily, prometheus-client makes the addition of collectable metrics to my bot straightforward.
Since I use nextcord for my discord bots, especially the extensions functionality (also known as cogs) of nextcord, I can enable the extension if I have enabled metrics in my config:
if Config().get('metrics.enabled'):
    self.load_extension('MarodasBot.Cogs.Metrics.Metrics')
In the cog, I add these two functions to enable (and disable) the web server:
class Metrics(Cog):
   def __init__(self, bot: MarodasBot):
        self.server, self.server_thread = start_http_server(
            addr=Config().get('metrics.host'),
            port=Config().get('metrics.port')
        )

    def cog_unload(self):
        self.server.shutdown()
Note: I'm only showing the parts of my code that are relevant to this chapter.
Adding metrics
Adding metrics is easy, as you just need to create a variable with some specific values and the library does all the rest.
start_time = Gauge('python_start_time_seconds', 'Time when the python program started')
memory_usage = Gauge('python_memory_usage', 'Total memory used by the program.')
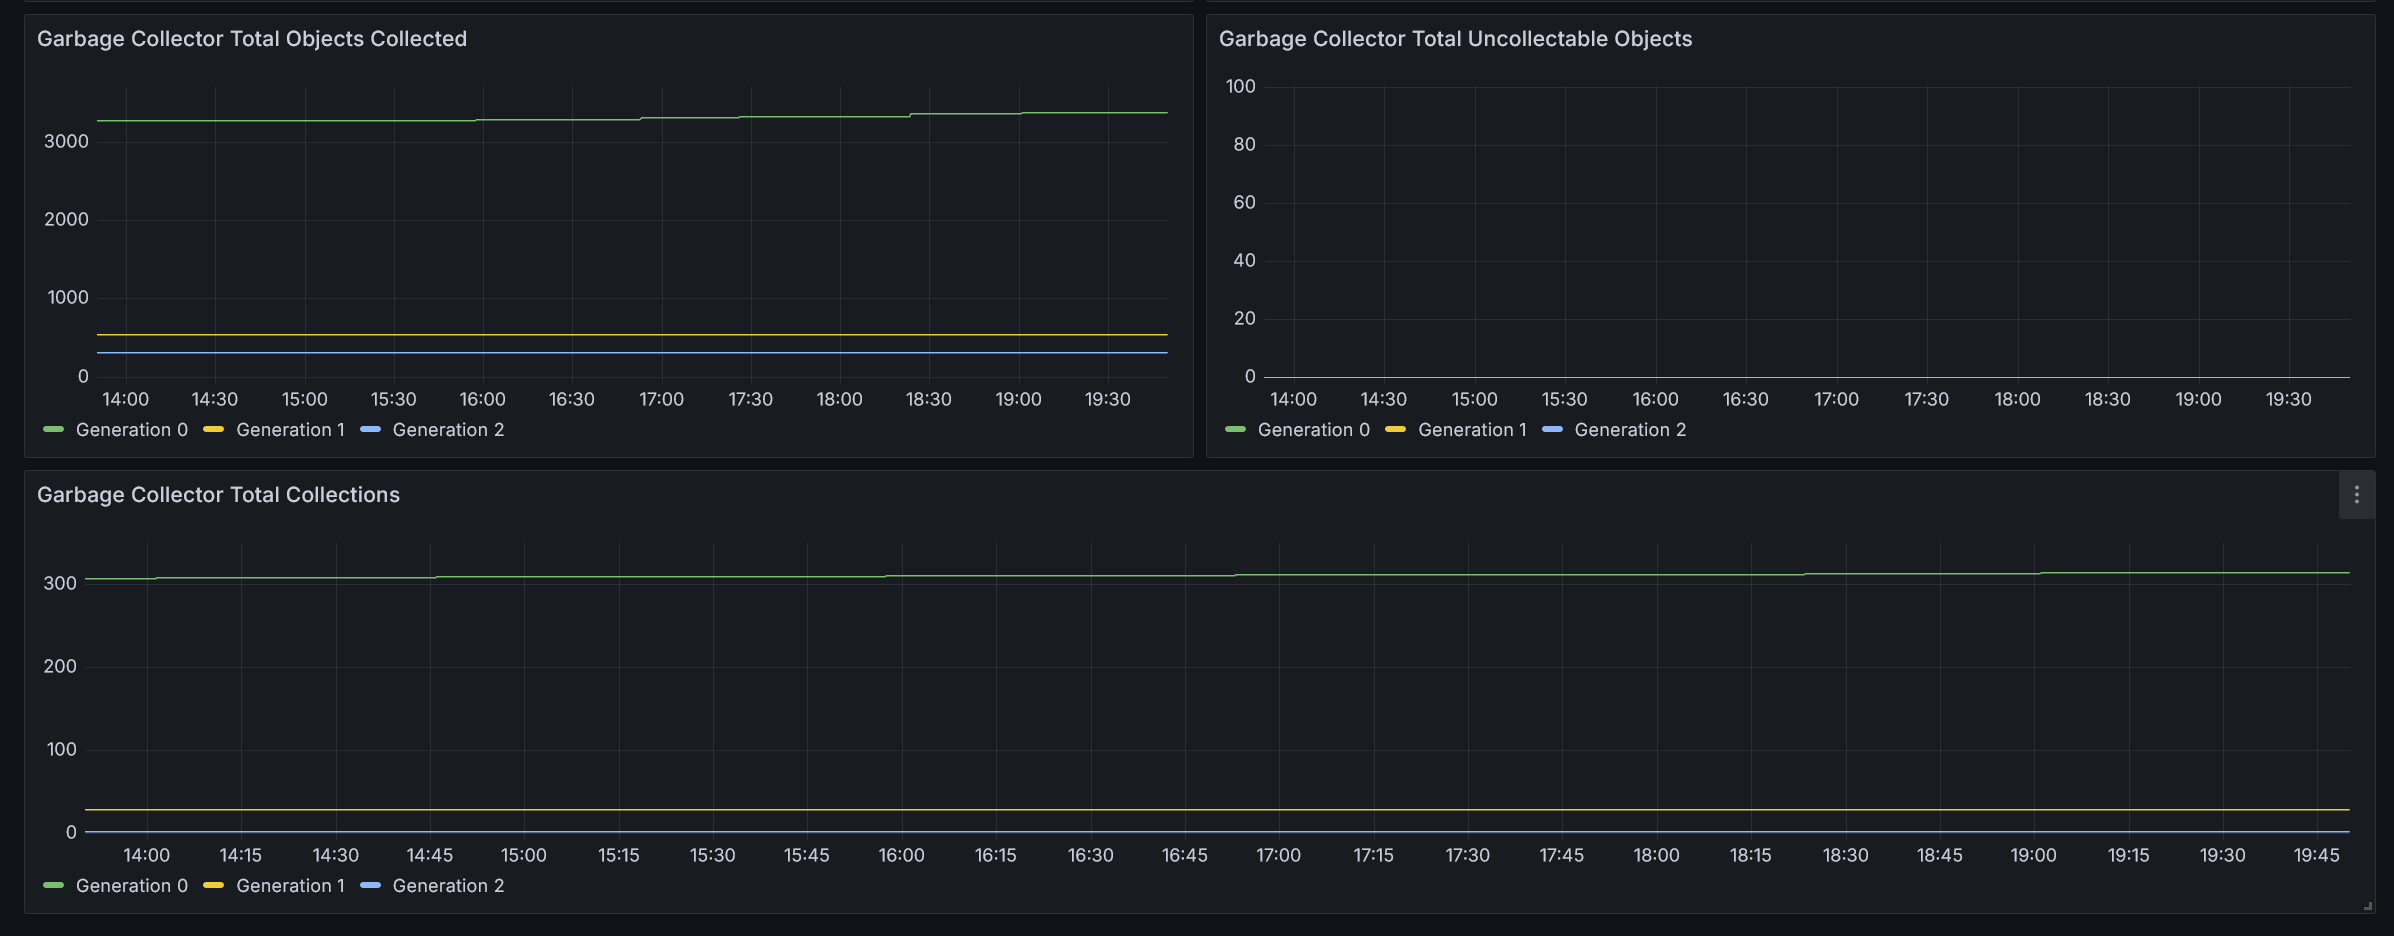
ping = Gauge('marodas_ping_milliseconds', 'Ping in milliseconds')prometheus-client comes with a few metrics by default, tracking the garbage collector metrics:
python_gc_objects_collected_totalpython_gc_objects_uncollectable_totalpython_gc_collections_total
Tracking metrics
But let's just begin with the static start_time metric because that has to be set just once! In my start script, where the python program connects to the database and starts the discord bot client, I added this line:
MetricDefs.start_time.set(time.time())And now I can use python_start_time_seconds in Grafana to see the uptime of my discord bot! But let's set the other metrics...
Tracking the live metrics was more complex than I thought in the beginning: I thought prometheus-client has a function that gets called when the Prometheus server requests the metrics (when a web request occurs). However, apparently this function doesn't exist (or I just didn't find it 😅), so I had to do it manually.
And "do it manually" means, I use another functionality of nextcord: Tasks. With these, I can just create a function, tell it in what interval it should be run and start (& stop) it.
class Metrics(Cog):
    def __init__(self, bot: MarodasBot):
        self.update_hardware_metrics.start()

    def cog_unload(self):
        self.update_hardware_metrics.stop()

    @tasks.loop(seconds=Config().get('metrics.update_interval'))
    async def update_hardware_metrics(self):
        process = psutil.Process()
        MetricDefs.memory_usage.set(process.memory_info().rss)
Getting the ping of the bot is a little bit harder, since I need to be connected to Discord to be able to get the ping. Luckily, Tasks can wait for something before it starts running the loop:
@tasks.loop(seconds=Config().get('metrics.update_interval'))
async def update_bot_metrics(self):
    MetricDefs.ping.set(round(self.bot.latency * 1000))

@update_bot_metrics.before_loop
async def before_update_metrics(self):
    await self.bot.wait_until_ready()
Creating the Grafana dashboard
Unfortunately, I can't say much about how I created my Grafana dashboard in detail because I just tried many things, and now I have visualizations that I'm happy with. I mostly copied settings from other dashboards where I liked these panels, and thus.. I have my dashboard :D
Conclusion and what is "too much?"
This was a fun journey, where I learned a lot about metrics: what collectable metrics actually are, how to collect these metrics, and how much collecting is too much.
While I experimented with different metrics, I had the idea to display how full my database is. Technically, this isn't really a bad idea, since I host my database on my server too, and there I don't have unlimited storage space. I know, a simple database doesn't take gigabytes of space. At least not if you have less than 10 users. Like I said, I wanted to try stuff. So I had programmed these metrics in, but removed them later, as they'd send ~13 requests to my database every 30 seconds, which is.. a lot for a metric that I don't really need.
Anyway, I hope this helps at least one person who struggles to add metrics to their python program! ...or that this post was fun to read. 😅